Public Information Office
301-763-3030
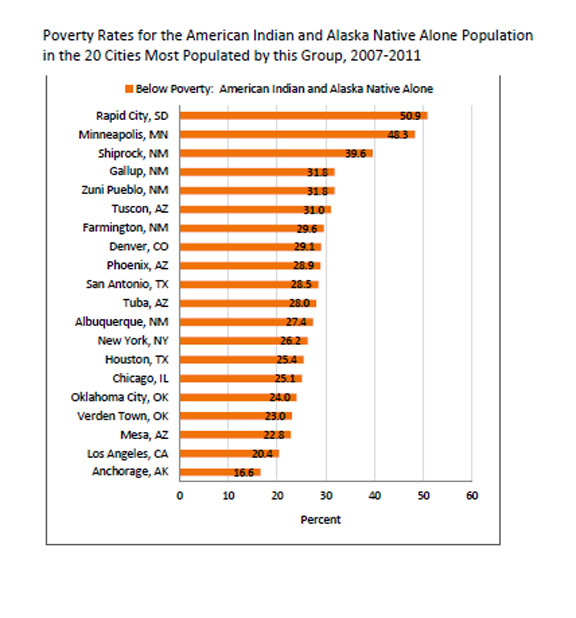
WEDNESDAY, FEB. 20, 2013 – The poverty rate for American Indians and Alaska Natives in Rapid City, S.D. (50.9 percent) was around three times the rate in Anchorage, Alaska (16.6 percent) and about 30 percent or greater in five other cities most populated by this group (Gallup, N.M.; Minneapolis; Rapid City, S.D.; Shiprock, N.M.; Tucson, Ariz.; and Zuni Pueblo, N.M.), according to American Community Survey data collected from 2007 to 2011 by the U.S. Census Bureau. See figure.
Nine states had poverty rates of about 30 percent or more for American Indians and Alaska Natives (Arizona, Maine, Minnesota, Montana, Nebraska, New Mexico, North Dakota, South Dakota and Utah).
“With the American Community Survey, we can look at the poverty rates for even the smallest race and Hispanic-origin groups,” said Suzanne Macartney, an analyst in the Census Bureau’s Poverty Statistics Branch.
These figures come from Poverty Rates for Selected Detailed Race and Hispanic Groups by State and Place: 2007-2011, an American Community Survey brief that presents poverty rates by race and Hispanic origin for the United States, each state and the District of Columbia. For the nation and each state, poverty rates are summarized for the major race groups. For the nation, each state and selected places, poverty rates are summarized for American Indians and Alaska Natives, detailed Asian groups with populations of 750,000 or more, Native Hawaiian and Other Pacific Islander groups with populations of 25,000 or more and Hispanic-origin groups with populations of 1 million or more.
Two race groups had poverty rates more than 10 percentage points higher than the national rate of 14.3 percent: American Indian and Alaska Native (27.0 percent) and black or African- American (25.8 percent). Rates were above the overall national average for Native Hawaiians and Other Pacific Islanders (17.6 percent), while poverty rates for people identified as white (11.6 percent) or Asian (11.7 percent) were lower than the overall poverty rate. Poverty rates for whites and Asians were not statistically different from each other. The Hispanic population had a poverty rate of 23.2 percent, about nine percentage points higher than the overall U.S. rate.
Other highlights:
- According to the 2007-2011 American Community Survey, 42.7 million people in the United States, or 14.3 percent, had income below the poverty level.
- For the Asian population, poverty rates were higher for Vietnamese (14.7 percent) and Koreans (15.0 percent) and lower for Filipinos (5.8 percent). Poverty rates for Vietnamese and Koreans were not statistically different from each other.
- For Asians, nine states had poverty rates below 10 percent (Connecticut, Delaware, Hawaii, Maryland, Nevada, New Hampshire, New Jersey, Virginia and South Carolina).
- Among Hispanics, national poverty rates ranged from a low of 16.2 percent for Cubans to a high of 26.3 percent for Dominicans.
The American Community Survey provides a wide range of important statistics about people and housing for every community across the nation. The results are used by everyone from town and city planners to retailers and homebuilders. The survey is the only source of local estimates for most of the 40 topics it covers, such as education, occupation, language, ancestry and housing costs for even the smallest communities. Ever since Thomas Jefferson directed the first census in 1790, the census has collected detailed characteristics about our nation’s people. Questions about jobs and the economy were added 20 years later under James Madison, who said such information would allow Congress to “adapt the public measures to the particular circumstances of the community,” and over the decades allow America “an opportunity of marking the progress of the society.”
Source: U.S. Census Bureau
