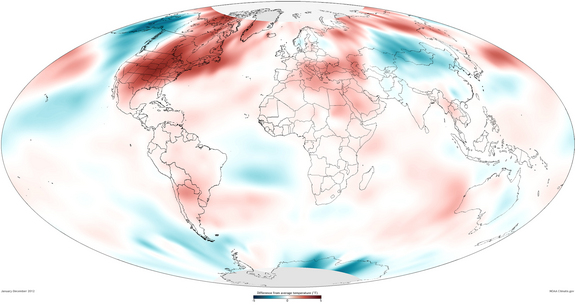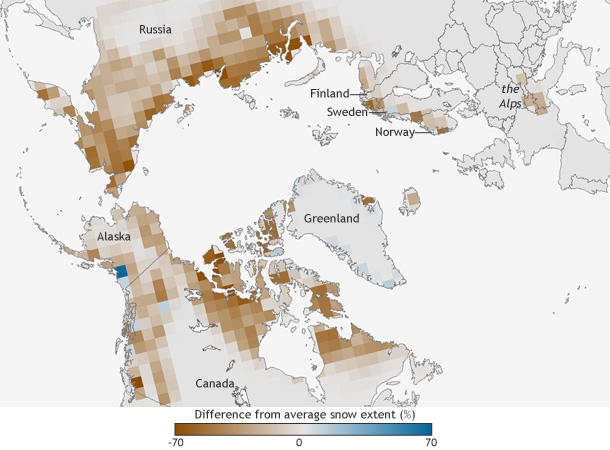
Credit: NOAA map by Dan Pisut, NOAA Environmental Visualization Lab
by Becky Oskin, OurAmazingPlanet Staff Writer | August 06, 2013 04:17pm ET
2012 was a year of climate records, from temperatures to ice melt to sea level rise, a newly released report on the state of the global climate says.
Even though natural climate cycles have slowed the planet’s rising temperature, 2012 was one of the 10 hottest years since 1880, according to the report released today (Aug. 6) by the National Oceanic and Atmospheric Administration.
One reason the world’s warming is slower in recent years is because of recent La Niña conditions in the Pacific Ocean, which cause atmospheric and ocean temperatures to cool, said Tom Karl, director of NOAA’s National Climatic Data Center during a news teleconference.”There are a number of factors that cause climate to vary from year to year, but when you look back at long-term trends, temperatures have been increasing consistently,” he said.
But in the Arctic, surface temperatures rose twice as fast in the past decade as lower latitudes, said Jackie Richter-Menge, a report co-author and research civil engineer with the U.S. Army Corps of Engineers. “The Arctic continues to be a region where we have some of the most compelling evidence of the fact that global temperatures are warming,” she said.

Credit: NOAA
A strong and persistent southerly airflow in spring 2012 contributed to the Arctic’s record warmth, Richter-Menge said. The effects included a record-low summer ice pack extent in the Arctic Ocean, and surface melting across 97 percent of the Greenland Ice Sheet. Richter-Menge said researchers are also seeing long-term changes, such as more coastal vegetation growing in the Arctic tundra and rising permafrost temperatures.
“The near records being reported from year to year are no longer anomalies or exceptions,” Richter-Menge said. “They have become the norm for us and what we expect to see in the near future.” [5 Ways Rapid Warming is Changing the Arctic]
Ice melt from Greenland and glaciers elsewhere are contributing to sea level rise, according to the climate report. In the past year, sea level rose a record 1.4 inches (35 millimeters) above the 1983 to 2010 average, said Jessica Blunden, a climatologist at NOAA’s Climatic Data Center and lead editor of the report. “It appears ice melt is contributing more than twice as much as warming waters,” she said during the teleconference. As the ocean warms, water expands, contributing to sea level rise.
The annual State of the Climate report compiles climate and weather data from around the world and is reviewed by more than 380 climate scientists from 52 countries. The report can be viewed online.
The planet hit several records or near records in 2012, the report said. These include:
- Record ice loss from melting glaciers. 2012 will be the 22nd year in a row of ice loss.
- Near-record ocean heat content, a measure of heat stored in the oceans. When the ocean holds more heat than it releases, its heat content increases.
- Record sea level rise of 1.4 inches above average.
- Record-low June snow cover in the Northern Hemisphere. The June snow cover has declined 17 percent per decade since 1979, outpacing the shrinking summer Arctic sea ice extent by 4 percent.
- Record-low summer Arctic sea ice extent. Sea ice shrank to its smallest summer minimum since record-keeping began 34 years ago.
- Record-high winter Antarctic sea ice extent of 7.51 million square miles (19.44 million square kilometers) in September.
- Record-high man-made greenhouse gas levels in the atmosphere. In 2012, for the first time, global average carbon dioxide concentrations hit 392 parts per million and exceeded 400 ppm at some observation sites. The number means there were 400 carbon dioxide molecules per 1 million air molecules.
Email Becky Oskin or follow her @beckyoskin. Follow us @livescience, Facebook & Google+. Original article on LiveScience.com.
