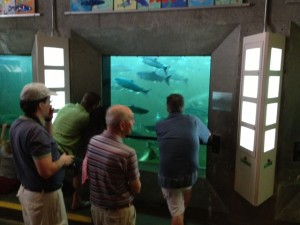
Mark Yuasa, The Seattle Times
The Lake Washington sockeye counts remain steady, and show no sign of dropping for now.
The updated run size of 147,240 sockeye through Thursday, July 11, is now just a little less than 7,000 fish ahead of the 2006 run during this same time frame, which was the last time a sport fishery was held in the large urban watershed. The preseason forecast this summer was 96,866.
The peak return time is usually between July 4 and July 12.
Last summer’s return of 145,815 shattered the preseason forecast of 45,871, and more than 20-million fry were released into the lake earlier this spring.
State Fish and Wildlife met Thursday (July 11) via a conference call with Muckleshoot, Suquamish and Tulalip tribal fisheries managers to review the Lake Washington sockeye run. The plan is to discuss the sockeye situation very soon with state Fish and Wildlife director Phil Anderson.
The director will be briefed on the technical group’s new management objective, which calls for an escapement spawning goal as low as 200,000. The current spawning escapement goal is 350,000, which has been in place at least three or four decades.
Concerns at this point are the sockeye returns appear to be declining, and looks like it peaked a week ago, but that could still climb or continue in a downward trend. Others discussed the warm water once the sockeye cross over the Locks, and into the thermal barrier between Lake Union and Lake Washington that creates a dire situation for fish.
Once the director is briefed and the tribal managers also meet, then another co-manager discussion will likely occur at some point next week.
If a reduction is eventually approved, and if the run continues to move toward and above that 200,000, then a really small fishery could still be possible. State managers call this a step harvest rate approach.
The question is whether this new policy would be agreed for three or four years, and be a test drive to the change in management as well as working out sticky topics like mitigation and hatchery issues.
The earliest time frame to have a possible fishery would be later this month, and it is likely fisheries managers will not make any decisions for at least a week or so.
Based on the latest numbers – adjusted for tribal C&S fisheries below the locks – the final run will end up between 175,000 and 225,000.
Single-day counts have looked like this since counting began on June 12 it was 2,778; June 13, 2,424; June 14, 1,285; June 15, 2,430; June 16, 3,081; June 17, 3,603; June 18, 3,851; June 19, 4,638; June 20, 2,961; June 21, 3,296; June 22, 10,782; June 23, 12,936; June 24, 4,545; June 25, 6,021; June 26, 5,577; June 27, 4,641; June 28 5,314; June 29, 9,084; June 30, 9,182; July 1, 51,35; July 2, 5,194; July 3 5,185; July 4, 3,309; July 5, 3,257; July 6, 2,988; July 7, 6,543; July 8, 3,791; July 9, 4,532; July 10, 4,748; and Thursday, July 11, 4,130.
Just to compare, here are the cumulative totals of counting from past years:
2006: 247; 803; 1,217, 1,975; 2,606; 3,179; 4,656; 6,623; 9,660; 12,785; 16,162; 20,840; 24,030; 29,158; 33,407; 37,917; 44,168; 53,334; 60,808; 70,016; 75,996; 79,476; 81,368; 85,638; 89,605; 97,431; 109,226; 119,495; 129,342; and 140,723 (453,543 was the final season total).
2007: 412; 892; 1,343; 2,058; 2,907; 3,467; 4,302; 6,595; 8,390; 9,795; 11,048; 13,013; 15,484; 17,604; 20,824; 22,692; 24,033; 26,148; 27,196; 27, 769; 29,180; 31,516; 33,236; 34,761; 37,117; 39,459; 40,160; 42,551; 43,348; and 43,927 (69,271 was the final season total).
2008: 236; 570, 894; 1,411; 1,774; 2,173; 2,785; 3,653; 4,530; 5,437; 6,577; 8,439; 9,752; 11,068; 11,564; 13,558; 15,509; 16,781; 17,910; 19,012; 19,012; 20,275; 21,443; 22,810; 23,726; 24,223; 24,969; 25,568; 26,187; 27,073; and 27,915 (33,702 was the final season total).
2009: 299; 825; 1,322; 1,797; 2,425; 2,880; 3,520; 3,931; 4,394; 5,064; 6,190; 7,057; 7,686; 8,156; 8,702; 9,414; 10,279; 11,296; 12,124; 12,933; 13,606; 14,306; 14,839; 15,494; 16,182; 16,735; 17,447; 17,945; 18,242; and 18,434 (22,166 was the final season total).
2010: 625; 1,027; 1,673; 2,342; 3,296; 4,194; 5,531; 6,756; 8,119; 9,475; 12,679; 15,656; 18,094; 20,616; 22,433; 27,449; 32,012; 36,538; 40,00; 45,518; 48,535; 50,789; 57,555; 62,012; 72,169; 79,600; 82,425; 86,421; 89,801; and 95,758 (161,417 was the final season total).
2011: 304; 563; 866; 1,218; 1,866; 2,512; 3,134; 3,452; 4,177; 5,319; 6,297; 7,221; 9,175; 11,011; 12,531; 13,794; 14,659; 14,969; 15,217; 15,612; 16,016; 16,913; 20,463; 23,824; 25,599; 26,596; 27,460; 29,131; 30,507; and 31m354 (43,724 was the final season total).
2012: 1,633; 2,320; 2,852; 5,035; 8,097; 9,821; 11,337; 13,577; 19,999; 23,546; 25,385; 27,628; 31,368; 37,191; 38,971; 42,701; 47,781; 50,565; 57,094; 59,036; 63,575; 69,340; 78,940; 85,072; 93,563; 99,661; 103,639; 109,974; 113,556; and 118,918 (145,815 was the final season total).
The last time Lake Washington was open for sport sockeye fishing was 2006 for 18 days with a return of 458,005 fish, the longest since 1996 when it was open 25 days. Other dates a fishery was held included 2004, 2002, 2000 and 1996.
